Visualize World Climate Data
Introduction
WorldClim is a set of global climate layers (climate grids) with a spatial resolution of about 1 square kilometer. The data can be used for mapping and spatial modeling in a GIS or with other computer programs.
Here, we want to visualize the WorldClim data to give research a direct reference.
Information about the methods used to generate the climate layers, and the units and formats of the data. You can find more info in the preferred citation: > Hijmans, R.J., S.E. Cameron, J.L. Parra, P.G. Jones and A. Jarvis, 2005. Very high resolution interpolated climate surfaces for global land areas. International Journal of Climatology 25: 1965-1978.
Data prepare
Data download
Data for current conditions (~1950-2000) was downloaded from http://worldclim.org/current. WorldClim has four types of spatial resoluation data for download. Here, we visualized the 2.5 arc-minutes resolution.
Four spatial resulations:
- 30 arc-seconds (~1 km)
- 2.5 arc-minutes
- 5 arc-minutes
- 10 arc-minutes
Available variables:
- Min. Temperature: average monthly minimum temperature (°C * 10)
- Max. Temperature: average monthly maximum temperature (°C * 10)
- Mean Temperature: average monthly mean temperature (°C * 10)
- Precipitation: average monthly precipitation (mm)
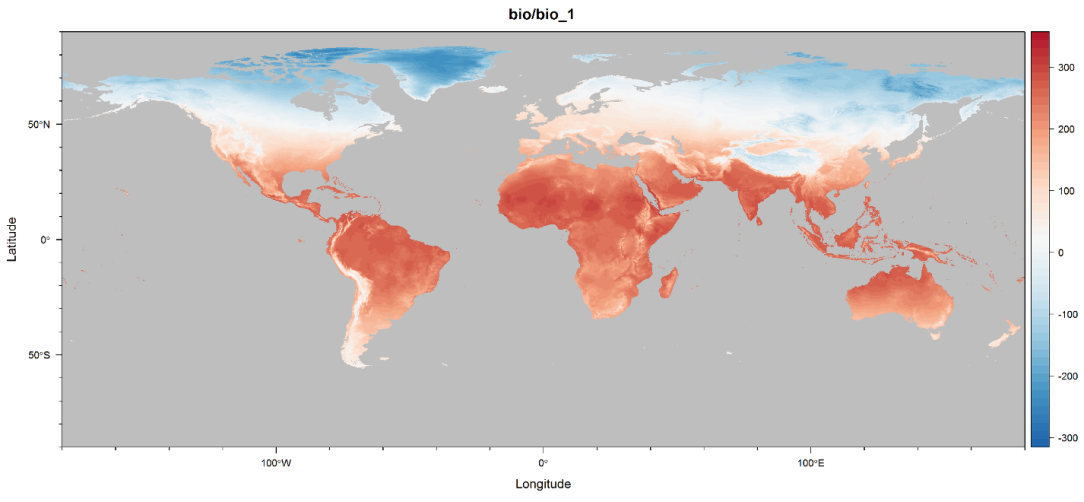
- Bioclim: bioclimatic variables derived from the tmean, tmin, tmax and prec
- BIO1 = Annual Mean Temperature
- BIO2 = Mean Diurnal Range (Mean of monthly (max temp - min temp))
- BIO3 = Isothermality (BIO2/BIO7) (* 100)
- BIO4 = Temperature Seasonality (standard deviation *100)
- BIO5 = Max Temperature of Warmest Month
- BIO6 = Min Temperature of Coldest Month
- BIO7 = Temperature Annual Range (BIO5-BIO6)
- BIO8 = Mean Temperature of Wettest Quarter
- BIO9 = Mean Temperature of Driest Quarter
- BIO10 = Mean Temperature of Warmest Quarter
- BIO11 = Mean Temperature of Coldest Quarter
- BIO12 = Annual Precipitation
- BIO13 = Precipitation of Wettest Month
- BIO14 = Precipitation of Driest Month
- BIO15 = Precipitation Seasonality (Coefficient of Variation)
- BIO16 = Precipitation of Wettest Quarter
- BIO17 = Precipitation of Driest Quarter
- BIO18 = Precipitation of Warmest Quarter
- BIO19 = Precipitation of Coldest Quarter
- Altitude: altitude (elevation above sea level) (m) (from SRTM)
Esri Grids to GeoTiff
We convert the orginal ESRI grids format to GeoTiff format with gdal_translate tools.
Visualiztion
We visualize these data with the help of R package named rasterVis.